
Extreme Precipitation Projections to Help New York State with Planning
 January 17, 2017 – Hurricanes Irene, Sandy, and Lee are examples of extreme precipitation events that have caused destruction and deaths in New York State. In 2009 alone, 175 total flooding events in New York State led to $32.82 million in property damage. The state is also still recovering from the $42 billion dollar toll of Superstorm Sandy, among others. Climate change is resulting in an increase in the frequency of heavy rainfall events.
Beacon train station, Beacon, New York. Photo: C. Klocker
To help New York State communities plan for effects of climate change, new graphics are now available showing the increased likelihood of heavy precipitation events. These graphs, called Intensity Duration Frequency (IDF) curves, show anticipated increases of storm events from two- to 100-year intervals, and are projected into the future as far as 2099. They can be found at http://ny-idf- projections.nrcc.cornell.edu/. These products are designed for use by municipal officials, researchers, planners, highway departments, and other decision-makers who need to take storm events into account. These IDF curves display how precipitation events are being affected by New York State’s rapidly changing climate.
In New York State, average summer and winter temperatures have been increasing since 1970 (2° F in summer and 4° F in winter). We are also expected to experience more extremely hot days and fewer cold winter days per year. These changes are affecting the water cycle, resulting in climatic effects such as an increase in the frequency and intensity of extreme precipitation events in the northeastern U.S. These changes could negatively impact society and lead to further distress for the State of New York.
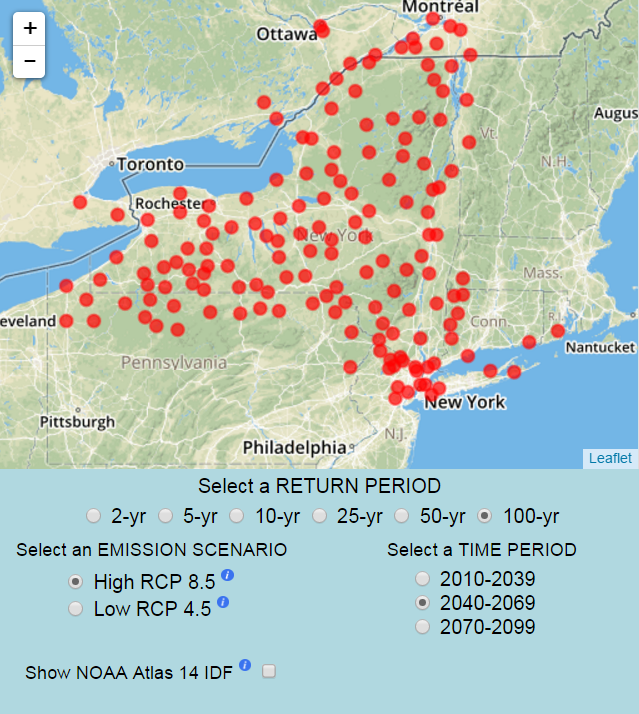
Map of weather station locations used for modeling. http://ny-idf-projections.
nrcc.cornell.edy/
In preparation for these impacts, the Department of Earth and Atmospheric Science at Cornell University has formed a partnership with the New York State Energy Research and Development Authority (NYSERDA) to ‘downscale’ global climate model outputs and create extreme precipitation projections that will ultimately be incorporated into climate-change adaptation planning for New York State. Christopher M. Castellano and Arthur T. DeGaetano completed this project through the Department of Earth and Atmospheric Science at Cornell University.
Communities can use these projections to aid in planning for more resilient communities by understanding the increased likelihood of major precipitation events. Flood levels may be reassessed, floodplain maps and codes may be adjusted, and culverts and bridge crossings may be altered to account for the likelihood of extreme weather. The website allows users to examine specific data throughout New York. Users can choose different locations, return periods (e.g., a “100-year” storm event), and greenhouse gas emission scenarios. Information is presented in several types of maps and charts to visualize how severe a storm event may be expected in different parts of the state.
Interested parties should take a look at the website to familiarize themselves with these models and better understand expected changes in our climate. http://ny-idf-projections.nrcc.cornell.edu/. A short video also helps explain the models: https://vimeo.com/187831975


Leave a Reply