
By Rick Wackernagel
Earth’s climate has been changing for a long time. One way to assess the significance of current changes is to compare them to past changes. Two important measures to compare are atmospheric temperature and carbon-dioxide (CO2) concentration. Temperature is both an indicator and a determinant of climate. It influences how much moisture and energy Earth’s atmosphere contains. Average annual global temperature is a common measure. It is often expressed as a temperature anomaly, the difference between one annual temperature and the average during a reference period, here 1951-1980. For example, the 2017 global annual average temperature anomaly of 0.90°C means the temperature that year was 0.90°C above the average temperature from 1951 to 1980. Recorded temperatures start in 1880. Estimates of temperatures back about 540 million years have been made using pollen in lake sediments, tree rings and other indirect indicators.
Climate scientists have found that the CO2 content of the atmosphere influences global temperatures. CO2 reflects infrared radiation coming from Earth so the radiation returns to Earth, rather than escaping into outer space. The CO2 content of Earth’s atmosphere has been measured since 1958. Air bubbles trapped in glacial ice, and concentrations of boron and carbon isotopes in marine sediments have allowed scientists to estimate atmospheric CO2 back about 540 million years, too.
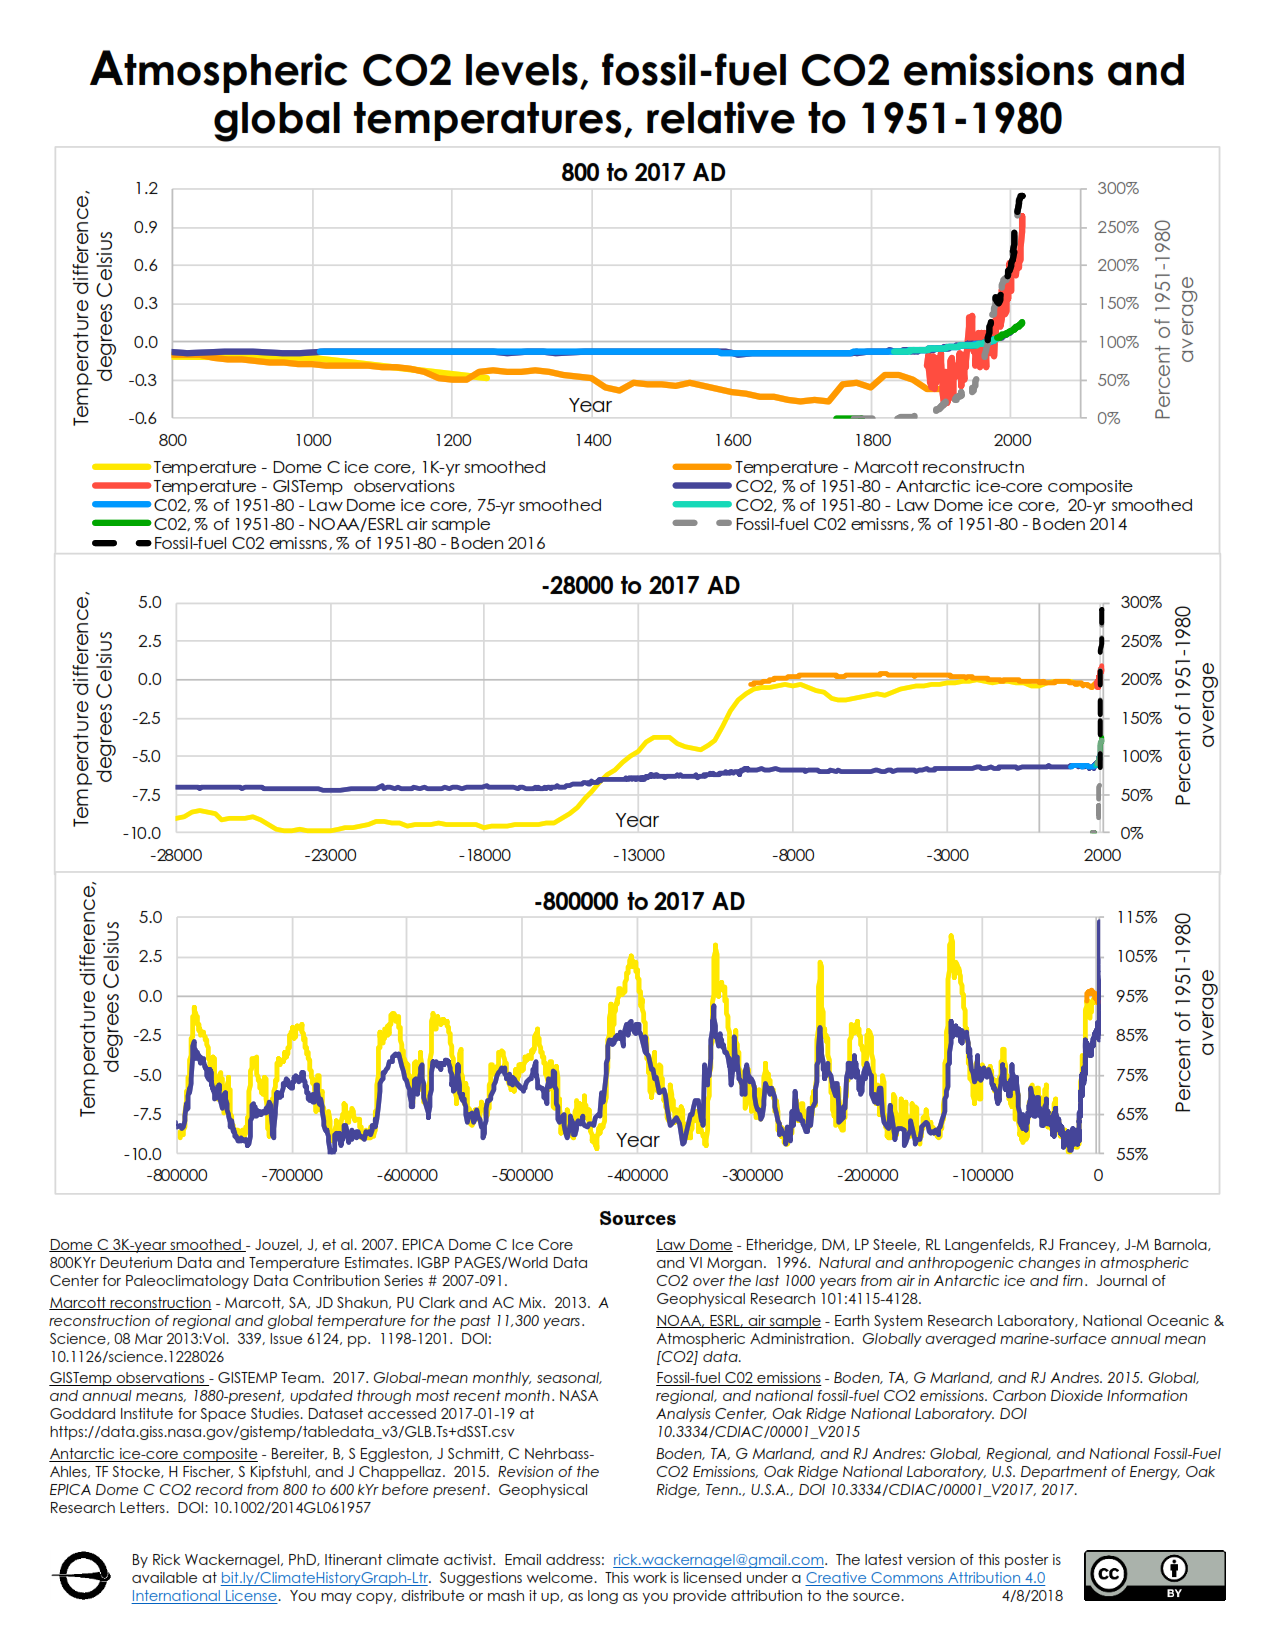
The graphs here show changes in Earth’s climate that scientists have observed. Temperature differences, or anomalies, are defined as above. Their baseline in the graph is 0°C. CO2 concentrations and fossil-fuel emissions are expressed as percentages of their 1951-1980 levels. Their baseline is 100%.
Reconstructed temperatures decline from 800 to 1740 AD, bottoming out at -0.37°C in 1740, i.e., 0.37°C below the 1951-1980 base. These reconstructed temperatures are smoothed and given in 10-year intervals. Temperature records beginning in 1880 are annual and show a lot of year-to-year variation. The average temperature anomaly for the 1736-1765 pre-industrial period is -0.26°C. Temperatures rise irregularly from roughly 1900 to 1967, with a spike in 1944. After 1967, they rise more consistently and rapidly, on average 0.018°C per year. The 2017 global temperature is 0.90°C above our baseline and 0.09°C below that of 2016, when an El Niño occurred.
The CO2 content of the atmosphere is usually expressed in parts per million (ppm). During our baseline period, it averages 323 ppm. CO2 levels are relatively stable from 800 to 1830 AD. From 1837 to the present, CO2 levels only rise or stay the same. They never go down. At 405 ppm in 2017, it is 26% above the baseline, and 46% above the pre-industrial average, 281 ppm.
Fossil-fuel emissions, measured in million metric tons and based on records of fossil-fuel extraction beginning in 1751, are also expressed as a percent of the 1951-1980 level. These emissions come from human activities. They start at 11 million metric tons per year in 1751, or 0.1% of baseline emissions. In 1946, they begin increasing strongly. In 2016, the latest year available, 36 billion metric tons of CO2 were emitted, 191% above the baseline.
Fossil-fuel emissions, CO2 levels and temperatures are positively correlated, with the most striking correlation between CO2 emissions and temperatures from 1967 to the present.
Expanding the time period back to 28,000 years BC reaches the last glacial period. Temperatures bottom out at ‑9.82°C. While their total rise into the interglacial period is much greater than the rise since our baseline, it is much slower. At their most rapid, at 10,000 years BC, they rise at 0.20°C per 50 years. In the 50 years from 1968 to 2017, they rise 0.98°C. Over these 30,000 years, CO2 levels rise slowly while temperatures rise, then stabilize until close to the present.
The 800,000-year record shows temperature and CO2 levels rising and falling in a highly correlated, somewhat cyclical pattern. Peaks represent interglacial periods and valleys glacial periods. They correlate well with oscillations in the Earth’s orbit, rotation and axis, known as Milanković cycles. A long-term decline in atmospheric CO2 is thought to have brought Earth’s temperature down to a level at which the Milanković cycles could cause alternating glaciation. Temperatures drop to almost 10°C below the baseline and rise to nearly 4°C above. Even here, the most rapid increase in temperature is 0.34°C per 50 years, much less than our 0.98°C.
Changes in CO2 levels also differ distinctly from recent experience. At no time prior to 1966 do CO2 levels reach our baseline. The highest CO2 level before 1 AD is 299 ppm, or 94% of the baseline. At 405 ppm, 2017 is 34% higher.
In summary, recent changes in temperature and CO2 levels are more rapid than in historical climate data.
Rick Wackernagel is an itinerant climate activist. Email address: rick.wackernagel@gmail.com.


Leave a Reply