
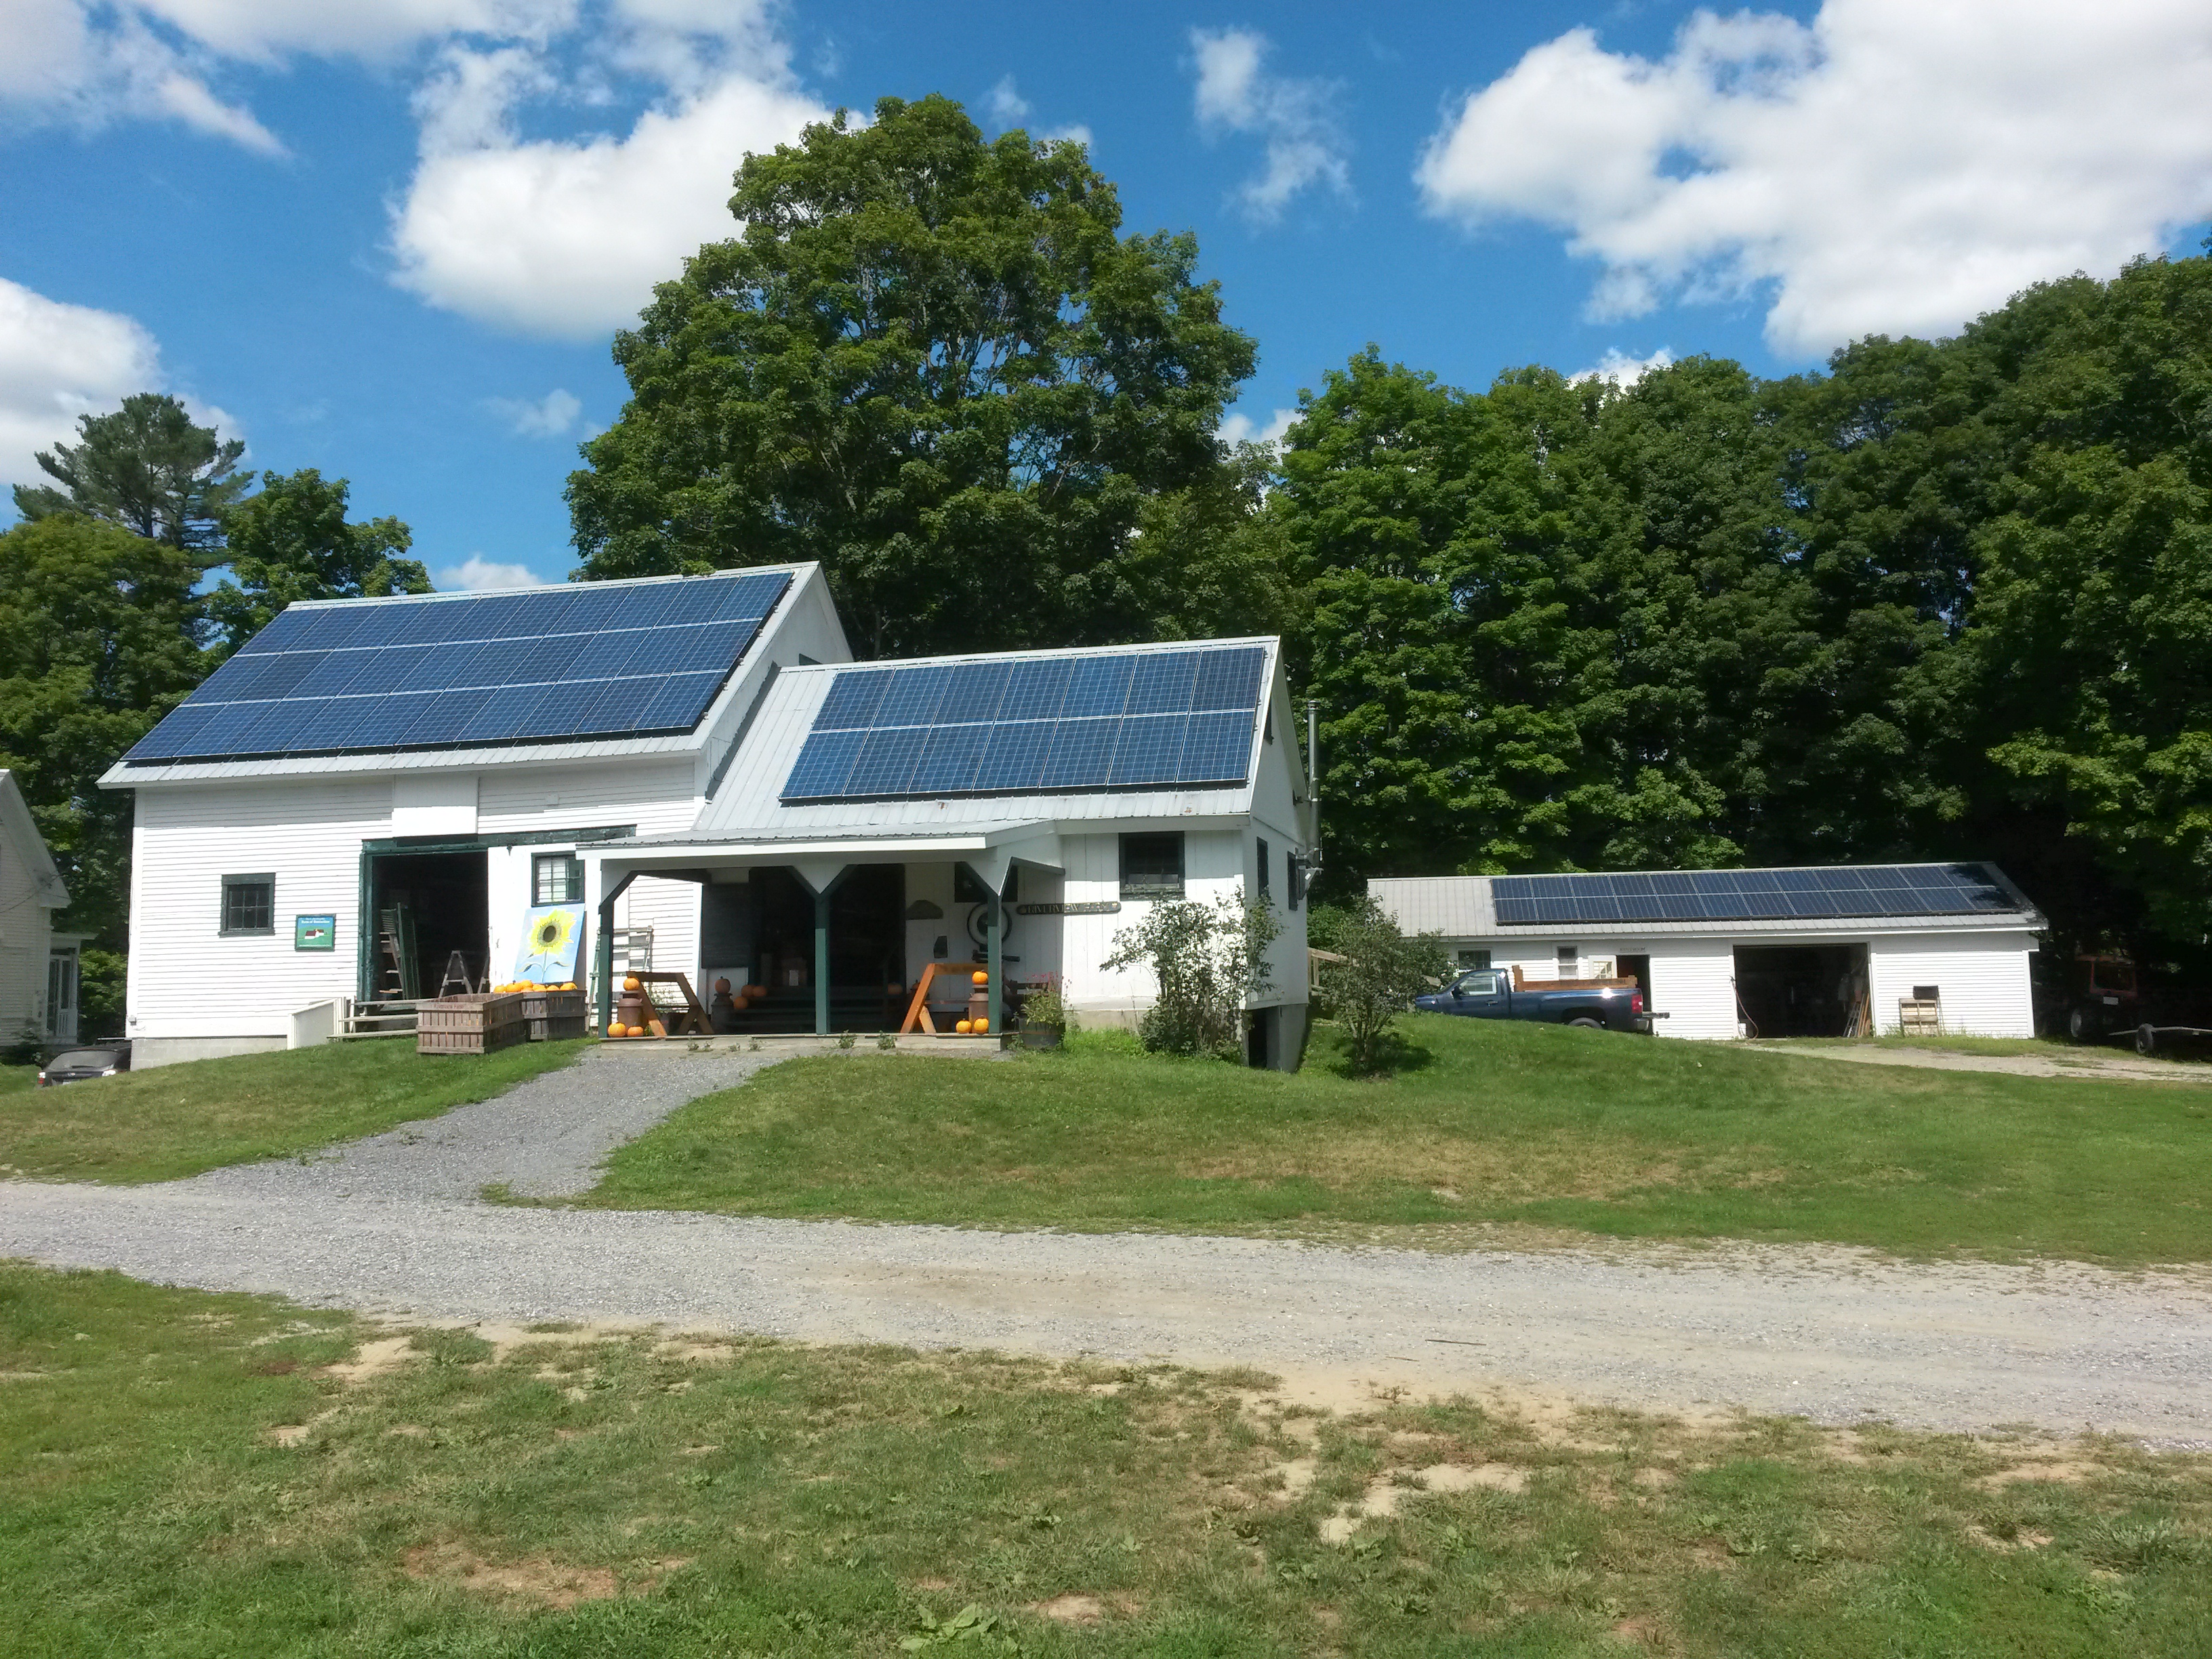
The solar array at pick-your-own Riverview Farm in Plainfield, NH powers the farm buildings as well as an electric vehicle charging station available to customers. Photo by Jonathan Teller-Elsberg. CC BY-SA.
Part 1 of 3
By Jonathan Teller-Elsberg
It’s exciting to be on the cusp of going solar, but just because you are doing something that both is financially advantageous and aligns with your ethical values doesn’t mean you should entirely drop your guard. Purchasing a solar photo-voltaic array or signing up for a multi-decade lease is a big enough deal that you need to understand how to compare options and evaluate the business with which you are considering signing on the dotted line.
Almost any solar installer offering to sell you a solar array will provide some general numbers such as:
-
a prediction of the number of kilowatt hours (kWh) to be generated by the solar array,
-
the net-metering value you get from those kWhs,
-
your cost per watt of solar array capacity, and
-
a measure of financial return.
Different installers may calculate these numbers in different ways, making it hard to get to an apples-to-apples comparison. It’s worth asking questions so you are comfortably informed.
As a residential user of net-metering you can usually receive non-taxable benefits, because you don’t receive any money from net-metering – no income, so no income tax. Instead, your living expenses are reduced through shrinking your electric bill. You have more money in your pocket, so it is as though you had received income, but the structure of the value exchange allows you to avoid taxation.
The story for businesses, on the other hand, is more complicated. Like residential net-metering customers, businesses are (usually) not paid directly for their solar production, instead simply seeing their bills reduced. However, a business doesn’t pay taxes on revenue anyway; businesses pay taxes on profits. And if a business saves money on its electric bill, then its profits can increase accordingly. Thus, businesses do incur indirect tax liability on their solar net-metering.
Predicted Solar Output
A basic prediction of solar electric output is based on solar access, a measure of the shade profile of the solar array location; climate-related conditions such as how cloudy or sunny is it on average at your location; the capacity of the solar array; tilt and directional orientation of the solar array; and possible loss due to snow cover.
Long-term predictions have to add in an additional factor, solar panel degradation, which is addressed in part two, “Net-Metering Value” in an upcoming issue of G.E.T.

A sample solar access diagram from the Solar Pathfinder. East is left, North is up. The white grid lines curving from left to right show the path of the sun during different months of the year, December at top. The yellow line traces the effective horizon. The grid area inside the yellow trace is the area of available solar access. CC BY-SA.
Solar access should be measured by the installer in the place that the array will be located. If your solar array might be on your roof, it is preferable that the solar access measurement be taken from the roof.
If the installer has not measured solar access at the prospective location, their prediction of solar electric output will necessarily be a rougher estimate. Some of the large, national solar companies rely only on satellite images of a roof to make their sales pitch. It’s true that you can glean an impressive amount of information from Google Earth, but it really is no substitute for an on-site evaluation.
If different installers measure solar access at the same location, do they get the same result? If not, find out why. Installers should be able to provide you with evidence of their measurements and explain their results.
For climate data, it is standard in the industry to rely on one of the databases included in PV Watts, an online solar production analysis tool provided by the National Renewable Energy Laboratory at http://pvwatts.nrel.gov/.
There are three climate database options in PV Watts, TMY2, TMY3, and SolarAnywhere Gridded Data. The first is based on actual measurements from 1961-1990 and is available for only a few locations. The second combines direct measurements from 1991-2010 with computer modeling and is available for several additional locations. The third, SolarAnywhere, is based primarily on modeled data and is available for any location. It has the advantage of giving you numbers that are specific to your neighborhood, and the disadvantage of being a much rougher estimate, since it has a weaker connection to directly measured conditions.
The SolarAnywhere results often diverge from the predictions given by the other databases, and when they do, they are frequently higher. For example, I compared the SolarAnywhere results to the TMY3 results for Lebanon, NH and Montpelier, VT, both for those locations precisely and for the four SolarAnywhere locations (north, east, south, west) directly adjacent to them. The SolarAnywhere results were between 8% and 14% higher than the predictions based on the TMY3 database.
SolarAnywhere-based predictions are not necessarily wrong, only more optimistic than the prediction you would probably get from one of the other databases. If you set your expectations based on more cautious predictions of electrical production, you have a better chance of being fully satisfied with your solar investment.
Are your different potential installers using the same climate database for their production estimates? If not, consider asking them to rerun their analyses using the same database as one another.
Be aware that the overall sunniness of one year compared to another can vary widely. So don’t be surprised if your solar production swings a fair bit from year to year. It isn’t necessarily evidence of a problem with the equipment or of poor work by your installer.
Solar array capacity is simply a measure of the rated output capacity of the solar array being offered – that is, of its ability to produce electricity if exposed to sunlight. A solar array that has 6 kilowatts (kW) of capacity made up of 24 solar panels of 250 watts each has the same capacity as 6 kW made up of 20 solar panels of 300 watts each. One of these alternatives might take up more or less space than the other, and one might cost more or less than the other, but the amount of electricity produced should not change as long as all the other factors of the installation are the same.
The tilt and orientation of your solar array can have a significant impact on its productivity. A solar array facing due south at a 35° tilt will produce a different amount of electricity than the same array facing due east, or the same array at a 45° tilt, and so forth.
The largest difference can arise among three common mounting options, an array that is fixed in orientation (i.e., it doesn’t move and always faces the same way), an adjustable rack system, and a tracking array (an array that moves throughout the day so that the panels are facing directly at the sun at all times).
As a rule of thumb for much of the Northeast, a tracking array will provide approximately 40% more electricity than a fixed array of the same capacity. The specific difference in productivity between a tracking and a fixed array will depend on the details of the location in question.
If you choose a roof-mounted array, you probably don’t have much control over the orientation of the array, and you will have to stick with a fixed-mount system. If you choose ground-mounted, you open up your options to include either an adjustable rack or tracking array, or to specify a fixed array of a preferred orientation and tilt.
Usually it makes sense to orient a fixed array to maximize overall annual production. If, however, your utility charges time-of-day rates and calculates net-metering credit accordingly, it might be advantageous to orient your array so that it produces the most electricity possible during high-cost periods, even if it is producing fewer total kWh. This is not a consideration for a tracking array, which produces the maximum amount of power possible at all times.
Snow cover will block solar production. This is, of course, related to the tilt of the solar array as well as climate. A flatter solar array will hold snow cover longer than one that is tilted more steeply and different locations have more or less snow to deal with. A tracking array will shed snow automatically, since at least twice a day it will be standing vertically.
In the Northeast, loss from snow cover can easily run to about 10% of potential annual production. The PV Watts estimator has an option to enter expected loss from snow cover, but the default value is zero. Ask your solar installer what assumption she or he has made about loss to snow cover when estimating solar production.
If you have a fixed array and it is safely accessible, you might clear snow off with a soft-bladed snow rake. An array high up on a roof may not be safely accessible, and you may not want to add new chores to your life. Be honest with yourself about how assiduously you will clear snow from the array over the next 20 or more years, and set your expectations for solar production accordingly.
In our next issue of Green Energy Times, we will discuss part 2 of this series: Net Metering Value.
Jonathan Teller-Elsberg works for Solaflect Energy, a Vermont-based manufacturer and installer of solar trackers. He has a master’s degree in Energy Regulation and Law from Vermont Law School.


Leave a Reply